
Shock Response Spectrum (SRS)

What is Shock Response Spectrum (SRS)?
The Shock Response Spectrum was first conceived by Dr. Maurice Biot and is described in his Ph.D. thesis published in 1932. Therefore, the SRS has been in existence for a long time. It has been used to characterize the frequency response of shock environments to estimate the maximum dynamic response of structures. The SRS is commonly used to characterize the frequency content of an acceleration time-history record. Shock response spectrum analysis is the maximum response of a series of single degree of freedom systems having the same damping to a given transient signal.

VR - Shock Response Spectrum Software
Events Characterized by a Shock Response Spectrum
Earthquakes, shipboard naval shock due to near-miss underwater explosions, and pyroshock are typical events characterized by a shock response spectrum.
An earthquake results from a sudden release of energy in the Earth’s crust that creates seismic waves. At the Earth’s surface, earthquakes manifest themselves by a shaking and sometimes displacement of the ground. The shaking in earthquakes can also trigger landslides and occasionally volcanic activity. Earthquakes are caused primarily by rupture of geological faults.
The elemental source of naval shock is the sudden application of external forces to a portion of the ship’s hull. The term “shock” is applied to the sudden, transient motion of an item of machinery as transmitted by the foundation or the mounting from the ship’s structure. Thus the term “shock” is employed in a relatively restricted sense, and does not include the destruction of the ship’s structure by means of direct exposure to an explosion, or the damage to equipment as the result of collision of a projectile or other object, or damage due to extreme distortion of the foundation.
Pyroshock refers to short-duration, high-amplitude, high frequency, transient structural responses in aerospace vehicles. Pyroshock on rocket or missile systems is attributable to explosive bolts and nuts, pin pullers, separation of spent rocket booster stages, linear cutting of the structure, and other actions that produce a near-instantaneous release of strain energy. To support structural analysis of typical military and aerospace systems, a 20,000 Hz frequency response is always more than adequate.

NASA engineers and technicians position the James Webb Space Telescope (inside a large tent) onto the shaker table used for vibration testing.
Engineers use an SRS test to evaluate a device’s response to a transient event likely to occur in the end environment. An SRS vibration test generates more complex shock pulses than a classical shock test. To generate a specific SRS response, engineers often synthesize one of several standard synthetic waveforms such as burst random or WavSyn.
The SRS can be used to:
Describe a transient event in general terms
Estimate the damage potential of an event
Design structure resonances
Define test specifications (particularly for seismic tests)
Replicate failure modes
How does SRS work?
The SRS is a representation of time-domain data in the frequency domain. It models the original waveform’s response channels using a set of theoretical, single-degree-of-freedom (SDOF), mass-damper-spring oscillators. The SRS sequentially applies filters of increasing frequency to the time domain data and plots the characteristics of the filtered waveform.
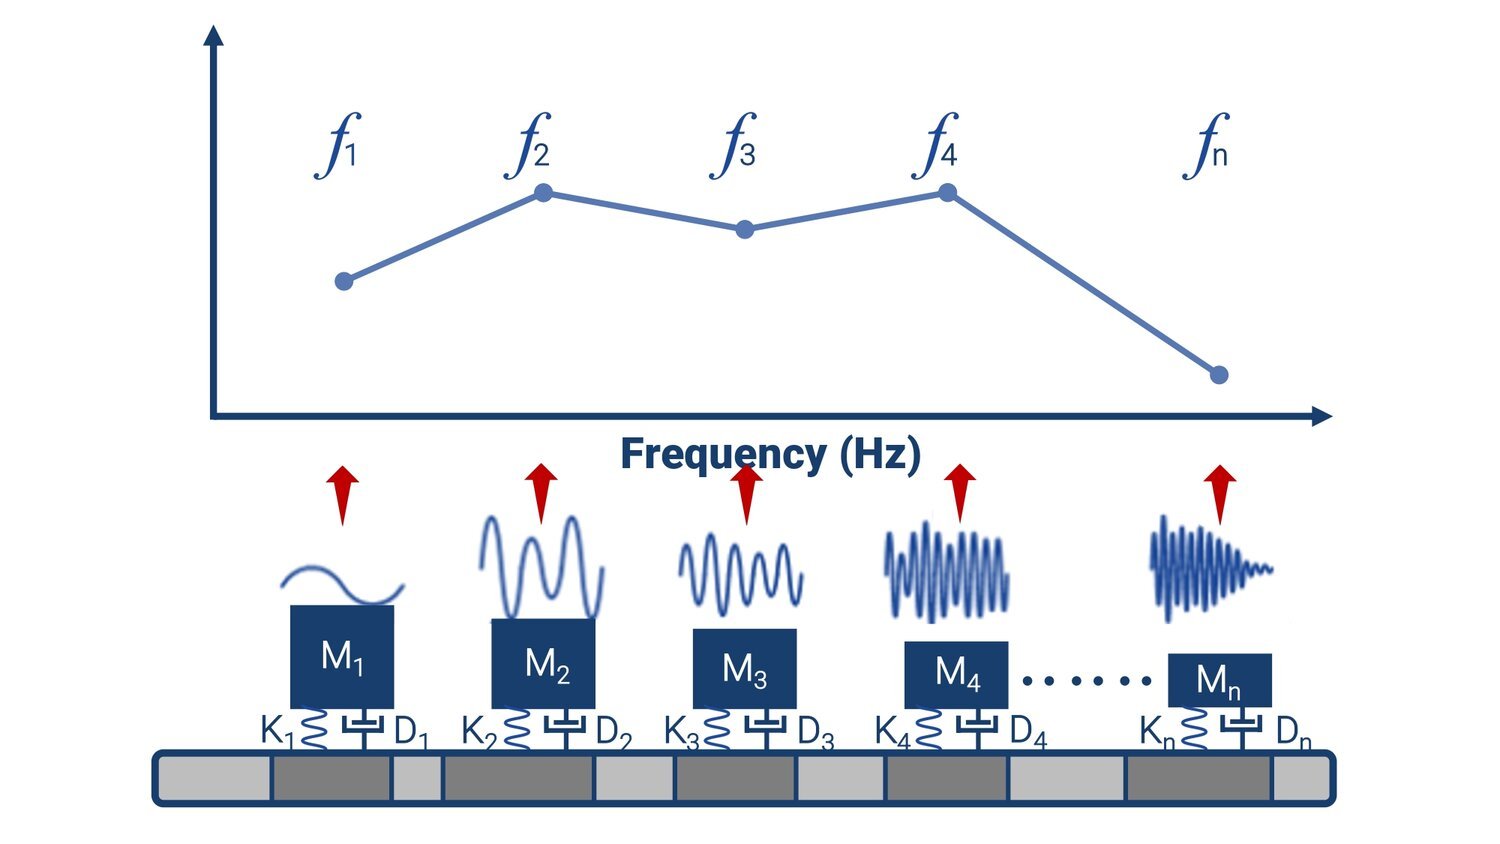
The horizontal axis of the plot represents the natural frequency of each SDOF. The theoretical response of each SDOF is plotted on the vertical axis. It is important to note that the SRS is not the actual response of the device under test but a theoretical representation of the response.
Applications in various industries
The aerospace industry is perhaps the prime user of the shock response spectrum method. Nevertheless, other industries also use this tool.
Earthquake Engineering
Equipment mounted in buildings must be designed and tested to withstand seismic excitation. This is particularly true if the building is located in an earthquake-prone area. Seismic shock response spectra are similar to spacecraft shock response spectra except for two differences:
Seismic shock response spectra are typically represented in terms of peak velocity rather than peak acceleration.
Qualitatively, the seismic spectrum is dominated by low-frequency energy, whereas the spacecraft spectrum is dominated by high-frequency energy.
Transportation and Shipping
The shock response spectrum method is also used to characterize certain transportation environments. MIL-STD-810E, for example, specifies a crash hazard shock response spectrum for certain components. This specification can be used to verify that a radio in a military vehicle would still function even after the vehicle was involved in a moderate collision.
Computer Industry
Hard disk drives are particularly susceptible to shock. The drives may receive a shock during a variety of environments:
Handling. For example, a drive may be dropped a few inches onto a worktable during the manufacturing process.
Chassis installation. A power tool may be used to install the mounting screws.
Transportation and shipping.
The computer industry is moving toward the shock response spectrum method to characterize these environments.

What are the Shortfalls of SRS?
Unlike the fast Fourier transform (FFT), the SRS does not include time or phase information. Therefore, engineers cannot recreate the original pulse from an SRS. Additionally, acceleration pulses that differ in amplitude, frequency content, and duration can produce an equivalent shock spectrum, resulting in an extensive waveform selection process.
Still, SRS remains the most prominent tool for complex shock testing. The SRS technique straightforwardly characterizes a shock environment and can be defined with data from multiple shock events.
Common SRS Test Specifications
IEEE-344: procedure for seismic qualification of electrical equipment in nuclear power plants
AASME NQA-1: nuclear quality assurance requirements
Bellcore (Telcordia) GR-63: procedure and test level for seismic qualification of telecommunications equipment. Defines five zones across the USA of varying seismic activity matching Uniform Building Code (UBC). Generally, not used for nuclear power plant equipment.
QME-100: ASME standard; procedure for seismic qualification of mechanical equipment
AC-156: requires structures and equipment to maintain integrity despite earthquakes
ISO 4866.2010: measurement of vibration and evaluation of the effect on structures
ISO/TS 10811-1:2000: vibration and shock in buildings with sensitive equipment
Considerations
A shock response spectrum can be calculated from acceleration time-history data. This spectrum shows the peak response for each natural frequency, assuming SDOF behavior. The convolution integral method is the most efficient calculation approach. This integration can be implemented using a digital recursive filtering algorithm.
Design Considerations
Engineers can use the shock response spectrum data to design spacecraft and avionics components which can reliably withstand expected shock environments.
For example, a design engineer could make hardware modifications to reduce the peak response by shifting the natural frequency.
Test Considerations
The shock response spectrum is also expedient for testing. Note that each time history has a unique shock response spectrum. On the other hand, consider a component test level specified as a shock response spectrum along with its tolerance bands. This specification can be met with a reasonable variety of input pulses. This characteristic allows test lab personnel some flexibility in preparing a suitable shock test method.
References:
Shock Response Spectrum – A Primer, J. Edward Alexander, BAE Systems, US Combat Systems Minneapolis, Minneapolis, Minnesota
AN INTRODUCTION TO THE SHOCK RESPONSE SPECTRUM, Revision S, By Tom Irvine
Vibration Research Corp.