
Simcenter 3D FE Model Correlation

Test/analysis model overlay with sensors and MAC
Simcenter™ 3D Finite Element (FE) Model Correlation software enables you to quantitatively and qualitatively compare simulation and modal test results, as well as compare two different simulations. It provides the tools needed to geometrically align the models, pair the modes from both solutions, view mode shapes side-byside and calculate/display correlation metrics. In addition to correlation, it includes pretest planning tools to help you better prepare your physical tests.
Simcenter 3D FE Model Correlation is available as an add-on to Simcenter 3D Structures or Simcenter 3D Engineering Desktop, enabling you to leverage the power and ease of use of the Simcenter 3D environment. When engineers create and simulate a finite element model, they often ask, “How do you know the analysis model is accurate?” Simcenter 3D FE Model Correlation helps answer this question by enabling you to compare the finite element model to measured test data so that engineers can assess the degree of match. A high degree of match, or correlation, between the analysis results and the test data gives engineers confidence that the analysis model is accurate. Simcenter 3D FE Model Correlation enables you to perform two types of comparisons.
In addition, Simcenter 3D FE Model Correlation provides pretest planning capabilities that use the finite element model and a normal mode solution to assist in selecting optimal sensor and exciter locations for modal testing.
Core functionality
Simcenter 3D FE Model Correlation provides the following core functionality.
Test-analysis correlation
Analytical results are compared to measured test data, which is considered to be the reference or baseline. A high degree of match provides a high level of confidence that the analytical model accurately represents the physics of the structure.
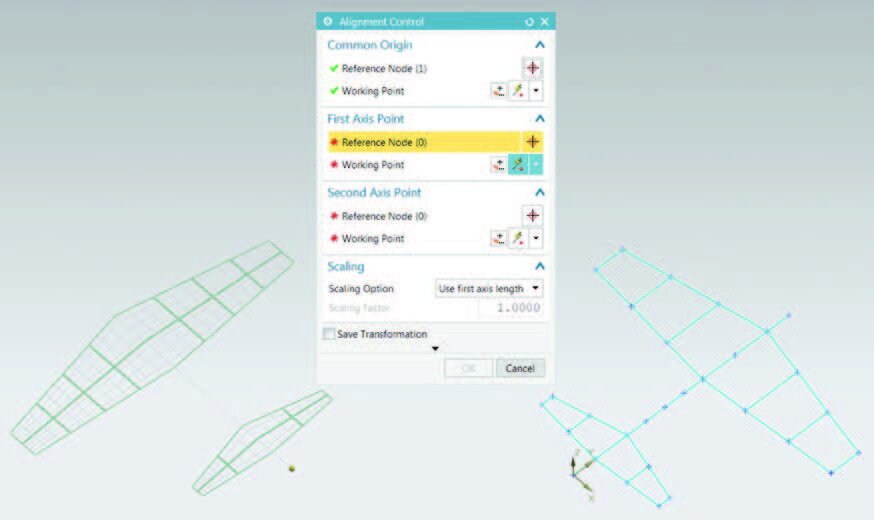
Test/analysis alignment with preview.
Analysis-analysis correlation
Two analysis models are compared, with one being the reference or baseline and the other being the working model. Each of the models can originate from different analysis programs. Alternatively, the models can originate from the same analysis program but with different levels of fidelity (e.g., a beam model might be compared to a shell model, or a coarse-mesh model might be compared to a fine-mesh model).
Analysis of normal mode solution access and results viewing
NX Nastran®, Abaqus, ANSYS and MSC. Nastran models are supported as both imported baseline results and Simcenter 3D working models.
Test solution import through UNV or UFF files
Legacy and current datasets are supported for geometry, mode shapes and frequency response functions. Import features include multiple global and local coordinate systems support (Cartesian, cylindrical or spherical), unit system dataset support, automatic active sensor detection and complex to real mode shape conversion.
Reviewing modal test results
You can review the test frequency response functions, animate the test mode shapes and overlay the test geometry and sensor locations to the analysis model.
Pretest planning
You can graphically select required and candidate measurement locations to support local or global Cartesian, cylindrical and spherical coordinate systems. In addition, the Min-MAC sensor selection algorithm is provided to optimize the AutoMAC matrix and to ensure that each mode of vibration is uniquely identified during the modal test. Pretest planning can also optimize the number and location of exciters to ensure that all modes are adequately excited during the test.

Pretest planning, selected sensors and autoMAC display
Geometry mapping
The finite element model typically contains many more nodes than points measured in the modal test. The software automatically generates a node map assigning the appropriate finite element node to the corresponding test measurement point based on the proximity of their global coordinates. If required, you can align models interactively.
Modal assurance criteria (MAC)
Modal assurance criteria quantitatively compare all possible combinations of mode shape pairs.
Coordinate modal assurance criteria (COMAC)
This method helps you identify the location of systematic differences between the two result sets.
Cross-orthogonality
The cross orthogonality method is similar to MAC except that the calculation is weighted by a reduced mass matrix. Typically, you perform this calculation for the test shapes, reduced analysis mass matrices and analysis mode shapes. You may also use the orthogonality calculation for comparing analysis-to-analysis through the reduced mass matrix (e.g. to verify sufficient TAM accuracy).
Mode pairing
You can pair the modes by different methods, including manually, and generate a table containing mode numbers, frequencies, percent difference and MAC value.
Visual comparison
You can display shapes and synchronized side-by-side animation directly from the mode pairs table.

Mode pairs and side-by-side animation test/analysis.
Are you ready to take your engineering simulations to the next level?
Join us for a FREE workshop on 16th June 2023 in Singapore, where Siemens and AscendTech (ETS) will guide you through the power of Simcenter 3D NX FE Model Correlation Software.
Discover how to compare simulation results with test data, ensuring accuracy and efficiency in your designs. Don't miss out on this opportunity to enhance your engineering excellence.
How can we help you?
Interested in our engineering and consultancy services? Send us your inquiry via the Engineering and Consultancy Services Form and we will be pleased to help you.