
Vibration Analysis: Good vs Bad Vibration Data

In the realm of industrial machinery and equipment, vibration data plays a pivotal role in predictive maintenance and performance assessment. Understanding the nuances between good and bad vibration data is essential for ensuring the operational efficiency, safety, and longevity of machinery. This article delves into the significance of differentiating between good and bad vibration data and how it can impact decision-making processes.
Understanding Vibration Data
Vibration data refers to the measurements of mechanical oscillations produced by industrial equipment during operation. This data is acquired through sensors strategically placed on machinery and provides insights into its condition. In an industrial context, vibration data acts as a crucial source of information for predictive maintenance, allowing maintenance teams to intervene before catastrophic failures occur.
Characteristics of Good Vibration Data
Good vibration data exhibits certain characteristics that make it reliable and valuable. Firstly, it is consistent and reproducible, meaning that under similar operating conditions, the readings remain relatively constant. Additionally, good vibration data displays a stable baseline, showing a clear distinction between regular operational vibrations and potential anomalies. Predictable patterns also contribute to the quality of the data, enabling maintenance experts to anticipate issues before they escalate.
Identifying Bad Vibration Data
On the other hand, bad vibration data can mislead maintenance professionals and result in incorrect decisions. Random spikes, peaks, or sudden drops in readings indicate potential sensor malfunctions or measurement errors. Inconsistent readings, where the same operating conditions produce widely different results, also signal unreliable data. Unexplained variations that don't align with the machine's behavior may be indicators of external factors affecting the sensor.
Identifying the Roots of Inaccurate Data
An often-encountered origin of distorted data stems from deficient electrical connections. Although wireless accelerometers might appear to alleviate this issue, they do not offer a complete solution. A telltale sign of such inaccurate data can be discerned through anomalies in the overall value, FFT spectrum, and time waveform. Notably, a pronounced alteration in the overall value, attributed to the characteristic 'ski slope' within the low-frequency range on the FFT spectrum, is an indicative symptom.

The distinct 'ski slope' pattern discernible on the FFT spectrum is a consistent hallmark of the presence of 'bad data'. This misaligned data is further evident in the erratic and patternless nature of the time waveform, characterized by extreme amplitudes oscillating between high and low values.
Insights from Spectrum Observation During Data Collection
Adopting the practice of monitoring spectrums during data collection through the Falcon Data Collector serves as a prudent approach to identifying faults, including those stemming from poor connections or transducer malfunctions. Facilitating this shift is a straightforward process:
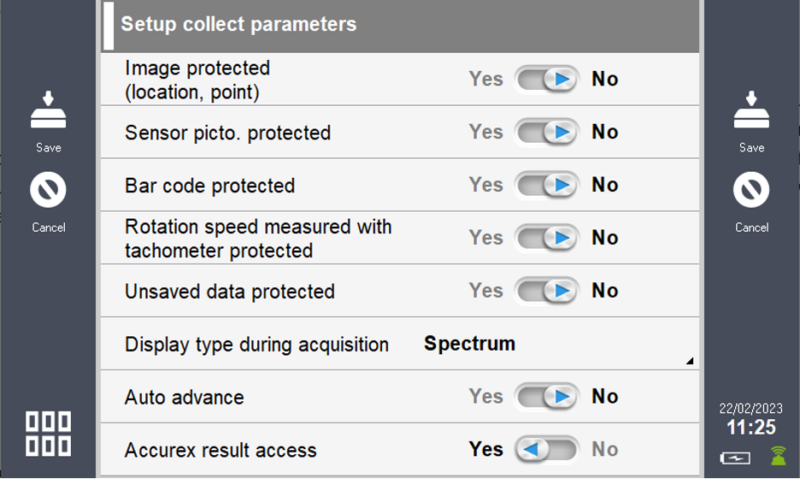
Navigate to 'Settings' in the Falcon Data Collector.
Select 'Collect' and proceed to 'Display type during acquisition'.
Opt for the 'Spectrum' display mode.
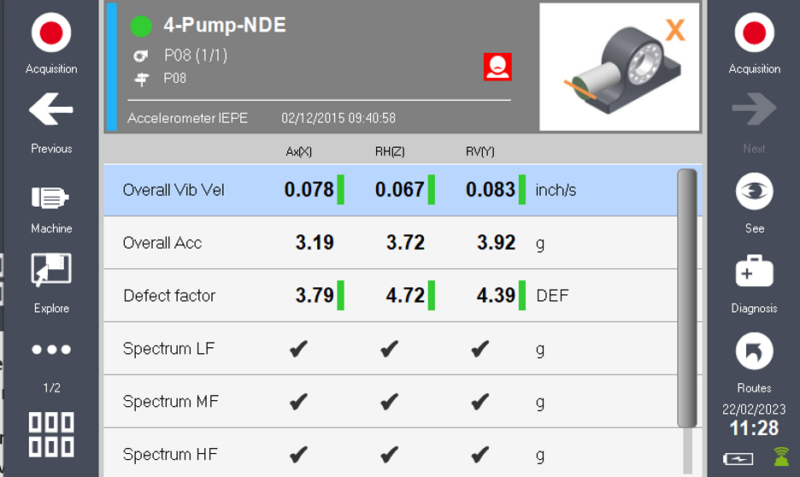
Vigilantly scrutinizing the spectrum during data acquisition unveils anomalies that might be triggered by suboptimal connections or transducer irregularities. Should a suspicious spectrum arise, or if the overall vibration value diverges significantly from its historical or anticipated norms, repeating the data acquisition becomes imperative. Discernibly, persistent vibration faults manifest consistently across multiple readings, while data tainted by faulty connections tends to be less consistent. Instances of starkly varying overall values across distinct readings point towards potential issues in this regard.
Addressing Alternate Causes of Erroneous Data
An additional wellspring of unreliable data originates from improperly identified measurements. Such occurrences often arise due to skipped points during data collection, inadvertently surveying the wrong machine, or misaligning the accelerometer in a direction inconsistent with the route instructions.
Mitigating this type of error is facilitated by the Falcon Data Collector, which permits users to incorporate photographic documentation of measurement points and machinery configurations. These images serve as crucial aids during both machine setup and field data acquisition.
Configuration and Collection Site Considerations
Lastly, we delve into the significance of data configuration and acquisition sites, as these aspects play an integral role in the context of distorted data. This facet is imperative for discussion since seemingly reliable data can be more misleading than data marred by connection issues.
Errors in data configuration often lead to inaccurate results where the FFT or overall value fails to encompass a sufficiently wide bandwidth to encapsulate the underlying fault. Attempting to identify gear mesh problems with a limited 60k bandwidth overall value, for instance, would render the data futile. Addressing this necessitates utilizing setups, like the Accurex configurations, which furnish comprehensive overall values across an expansive frequency spectrum, thus circumventing this particular challenge.
The positioning of data collection sites further adds complexity to the issue of data accuracy. Inadequate proximity to the bearing might preclude the acquisition of meaningful high-frequency data, thereby obstructing early detection of bearing faults or lubrication deficiencies. In extreme cases, significant distance could lead to complete oversight of machinery issues, while engendering a false sense of assurance among stakeholders reliant on vibration data findings.
In conclusion, enhancing vibration data quality is a multidimensional endeavor that involves identifying and rectifying the root causes of inaccuracies. Vigilance during data collection, meticulous setup and acquisition practices, and a comprehensive understanding of potential pitfalls contribute collectively to the pursuit of reliable and valuable vibration insights.
FAQs
Can vibration data analysis prevent all machine failures?
Vibration data analysis significantly reduces the risk of unexpected failures, but some factors might still lead to unforeseen issues.How often should vibration sensors be calibrated?
Regular calibration, at least once a year, is recommended to ensure accurate measurements.Is vibration data analysis suitable for all types of machinery?
Yes, vibration data analysis can be applied to various types of machinery across different industries.What happens if bad data leads to unnecessary maintenance?
Unnecessary maintenance can incur extra costs and potentially increase downtime, affecting overall productivity.
We offer a complete range of services designed to optimize condition-based maintenance, contact us now!
Fill the form to schedule a FREE demo
Credit: ACOEM